
Data analysis with charts in ChatGPT
Which ChatGPT plans have Data analysis with charts?
Free and Go: No. Plus, Pro 100, Pro 200, Pro 500, Business Standard, Business Premium, Enterprise and Edu: Not checked yet*.
Your plan
No. ChatGPT Free doesn't have Data analysis with charts.
No. ChatGPT Go doesn't have Data analysis with charts.
We haven't checked whether Data analysis with charts is in ChatGPT Plus.
We haven't checked whether Data analysis with charts is in ChatGPT Pro 100.
We haven't checked whether Data analysis with charts is in ChatGPT Pro 200.
We haven't checked whether Data analysis with charts is in ChatGPT Pro 500.
We haven't checked whether Data analysis with charts is in ChatGPT Business Standard.
We haven't checked whether Data analysis with charts is in ChatGPT Business Premium.
We haven't checked whether Data analysis with charts is in ChatGPT Enterprise.
We haven't checked whether Data analysis with charts is in ChatGPT Edu.
Tell us your plan to see the answer for it.
In each plan
For you
| Free | NoNo interactive tables and charts. Static chart images only. |
|---|---|
| Go | NoNo interactive tables and charts. Static chart images only. |
| Plus | Not checked yet* |
| Pro 100 | Not checked yet* |
| Pro 200 | Not checked yet* |
| Pro 500 | Not checked yet* |
For teams, companies and schools
| Business Standard | Not checked yet* |
|---|---|
| Business Premium | Not checked yet* |
| Enterprise | Not checked yet* |
| Edu | Not checked yet* |
Source for the checked plans: Plans and Pricing, checked on 20 Oct 2026
Step by step
Attach the test sales CSV and ask for charts by month, region and product.
Show total revenue by month, by region and by product. Make a bar chart for each.
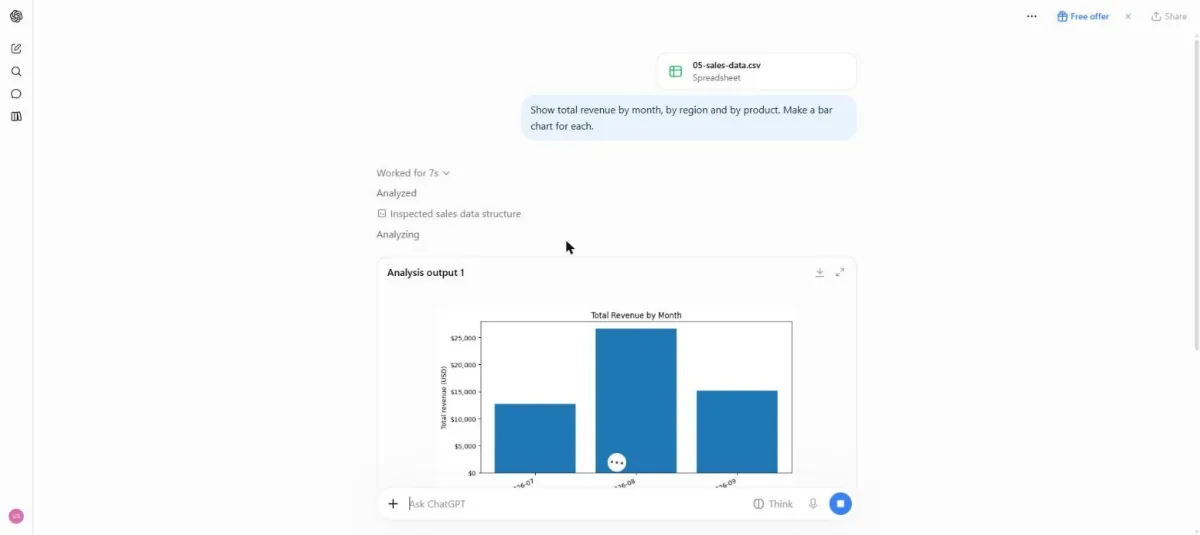
You see a monthly revenue bar chart in an Analysis output box.
Scroll to the end of the answer.
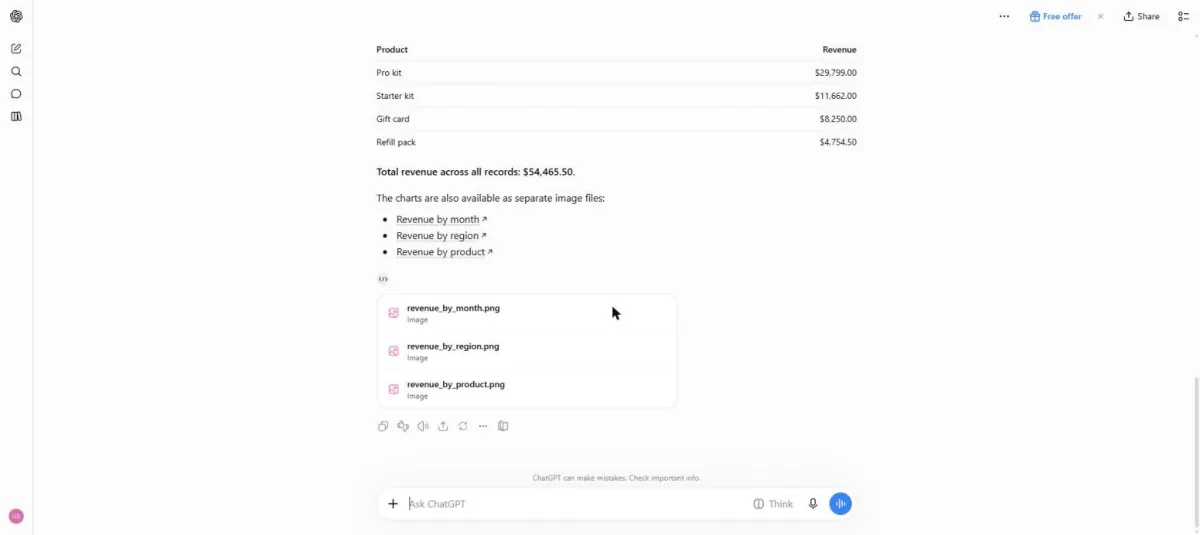
You see a totals table and three chart image files.
Click a picture to see it full size.